A graphical representation of the individual results of each study included in a meta-analysis together with the combined meta-analysis result.
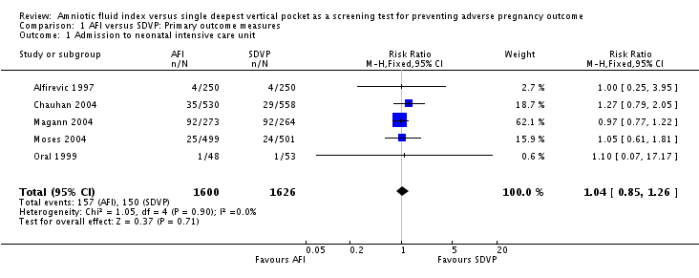
The plot also allows readers to see the heterogeneity among the results of the studies.
The results of individual studies are shown as squares centred on each study’s point estimate. A horizontal line runs through each square to show each study’s confidence interval – usually, but not always, a 95% confidence interval.
The overall estimate from the meta-analysis and its confidence interval are shown at the bottom, represented as a diamond. The centre of the diamond represents the pooled point estimate, and its horizontal tips represent the confidence interval.
